Following up on the “Collecting Data in the Field” post, here is a breakdown of my current work routine in terms of tools when it comes to field data collection.
Basically, I head out to the field to mark points of interest and record info, either through notes or photos. For example, I might need to pin the location of site improvements and record details that help determine their value. Other times, I just need to map out housing or occupancy in a specific area. I might even need to track a specific path within an area and add photos to build a detailed report.
Generally, this field data is used for reports and maps that serve different audiences. Some are as simple as a basic map layout, while others are more complex, showing land-use classes, slope levels, and specific areas within the property.
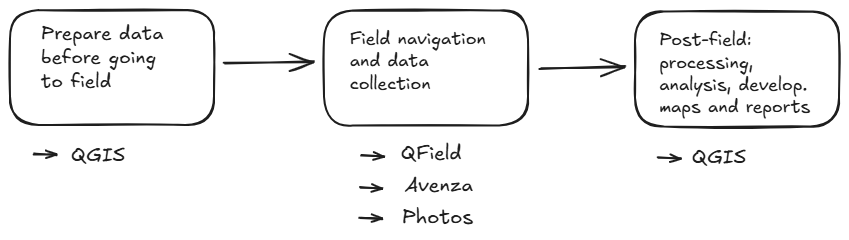
As I showed in my previous post, the workflow looks something like this:
Note: This is just my way of working based on my current needs. It’s obviously not the only way, and everyone should test and find what works best for them.
- Before heading out to field —> QGIS
I use QGIS to create context maps of the area. I also pull in the boundaries of the areas I’m interested in (rural properties, demarcated zones, etc.). Sometimes, other layers like water bodies, roads, or public areas are key too.
It’s not always necessary, but depending on the job, I create two types of maps: one for QField and a GeoPDF for Avenza.
QFIELD
For maps used in QField (the “field” version of QGIS), the main trick is setting up a specific project and moving that data to the app.
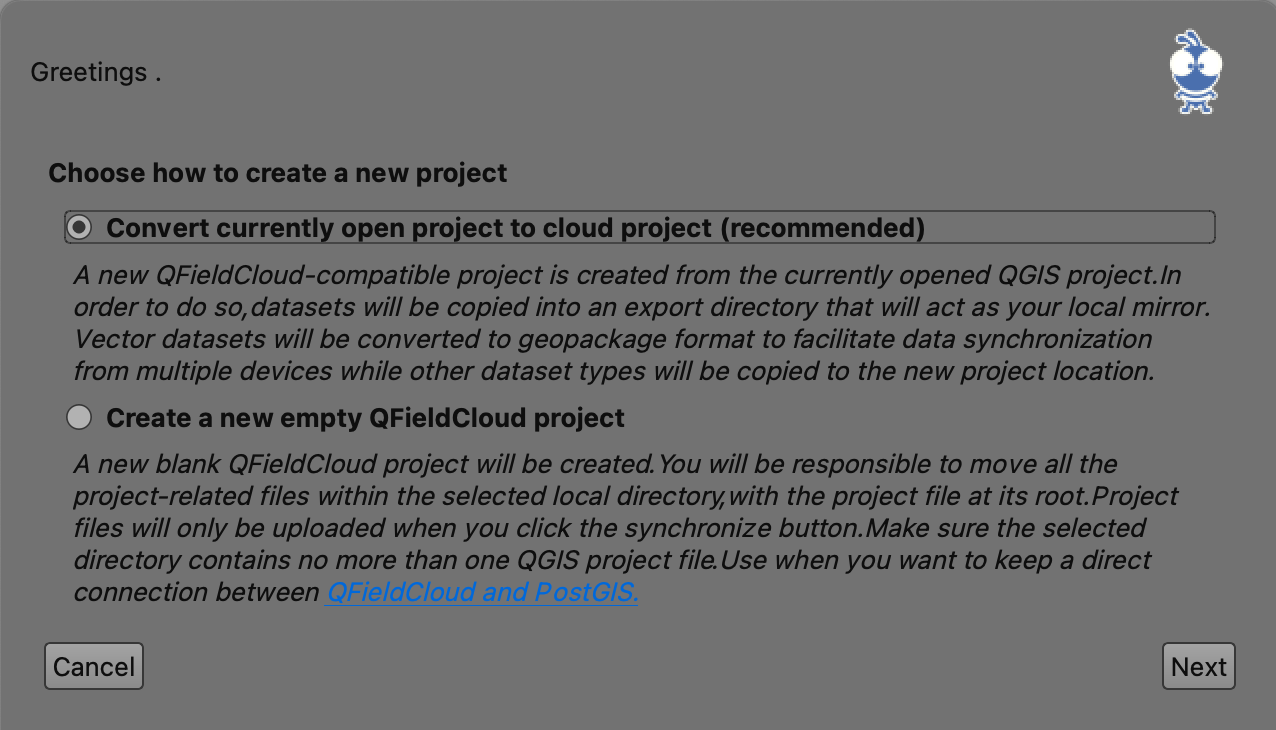
There are a few ways to do this, but one of the easiest is using the QField Sync plugin in QGIS to package and sync everything.
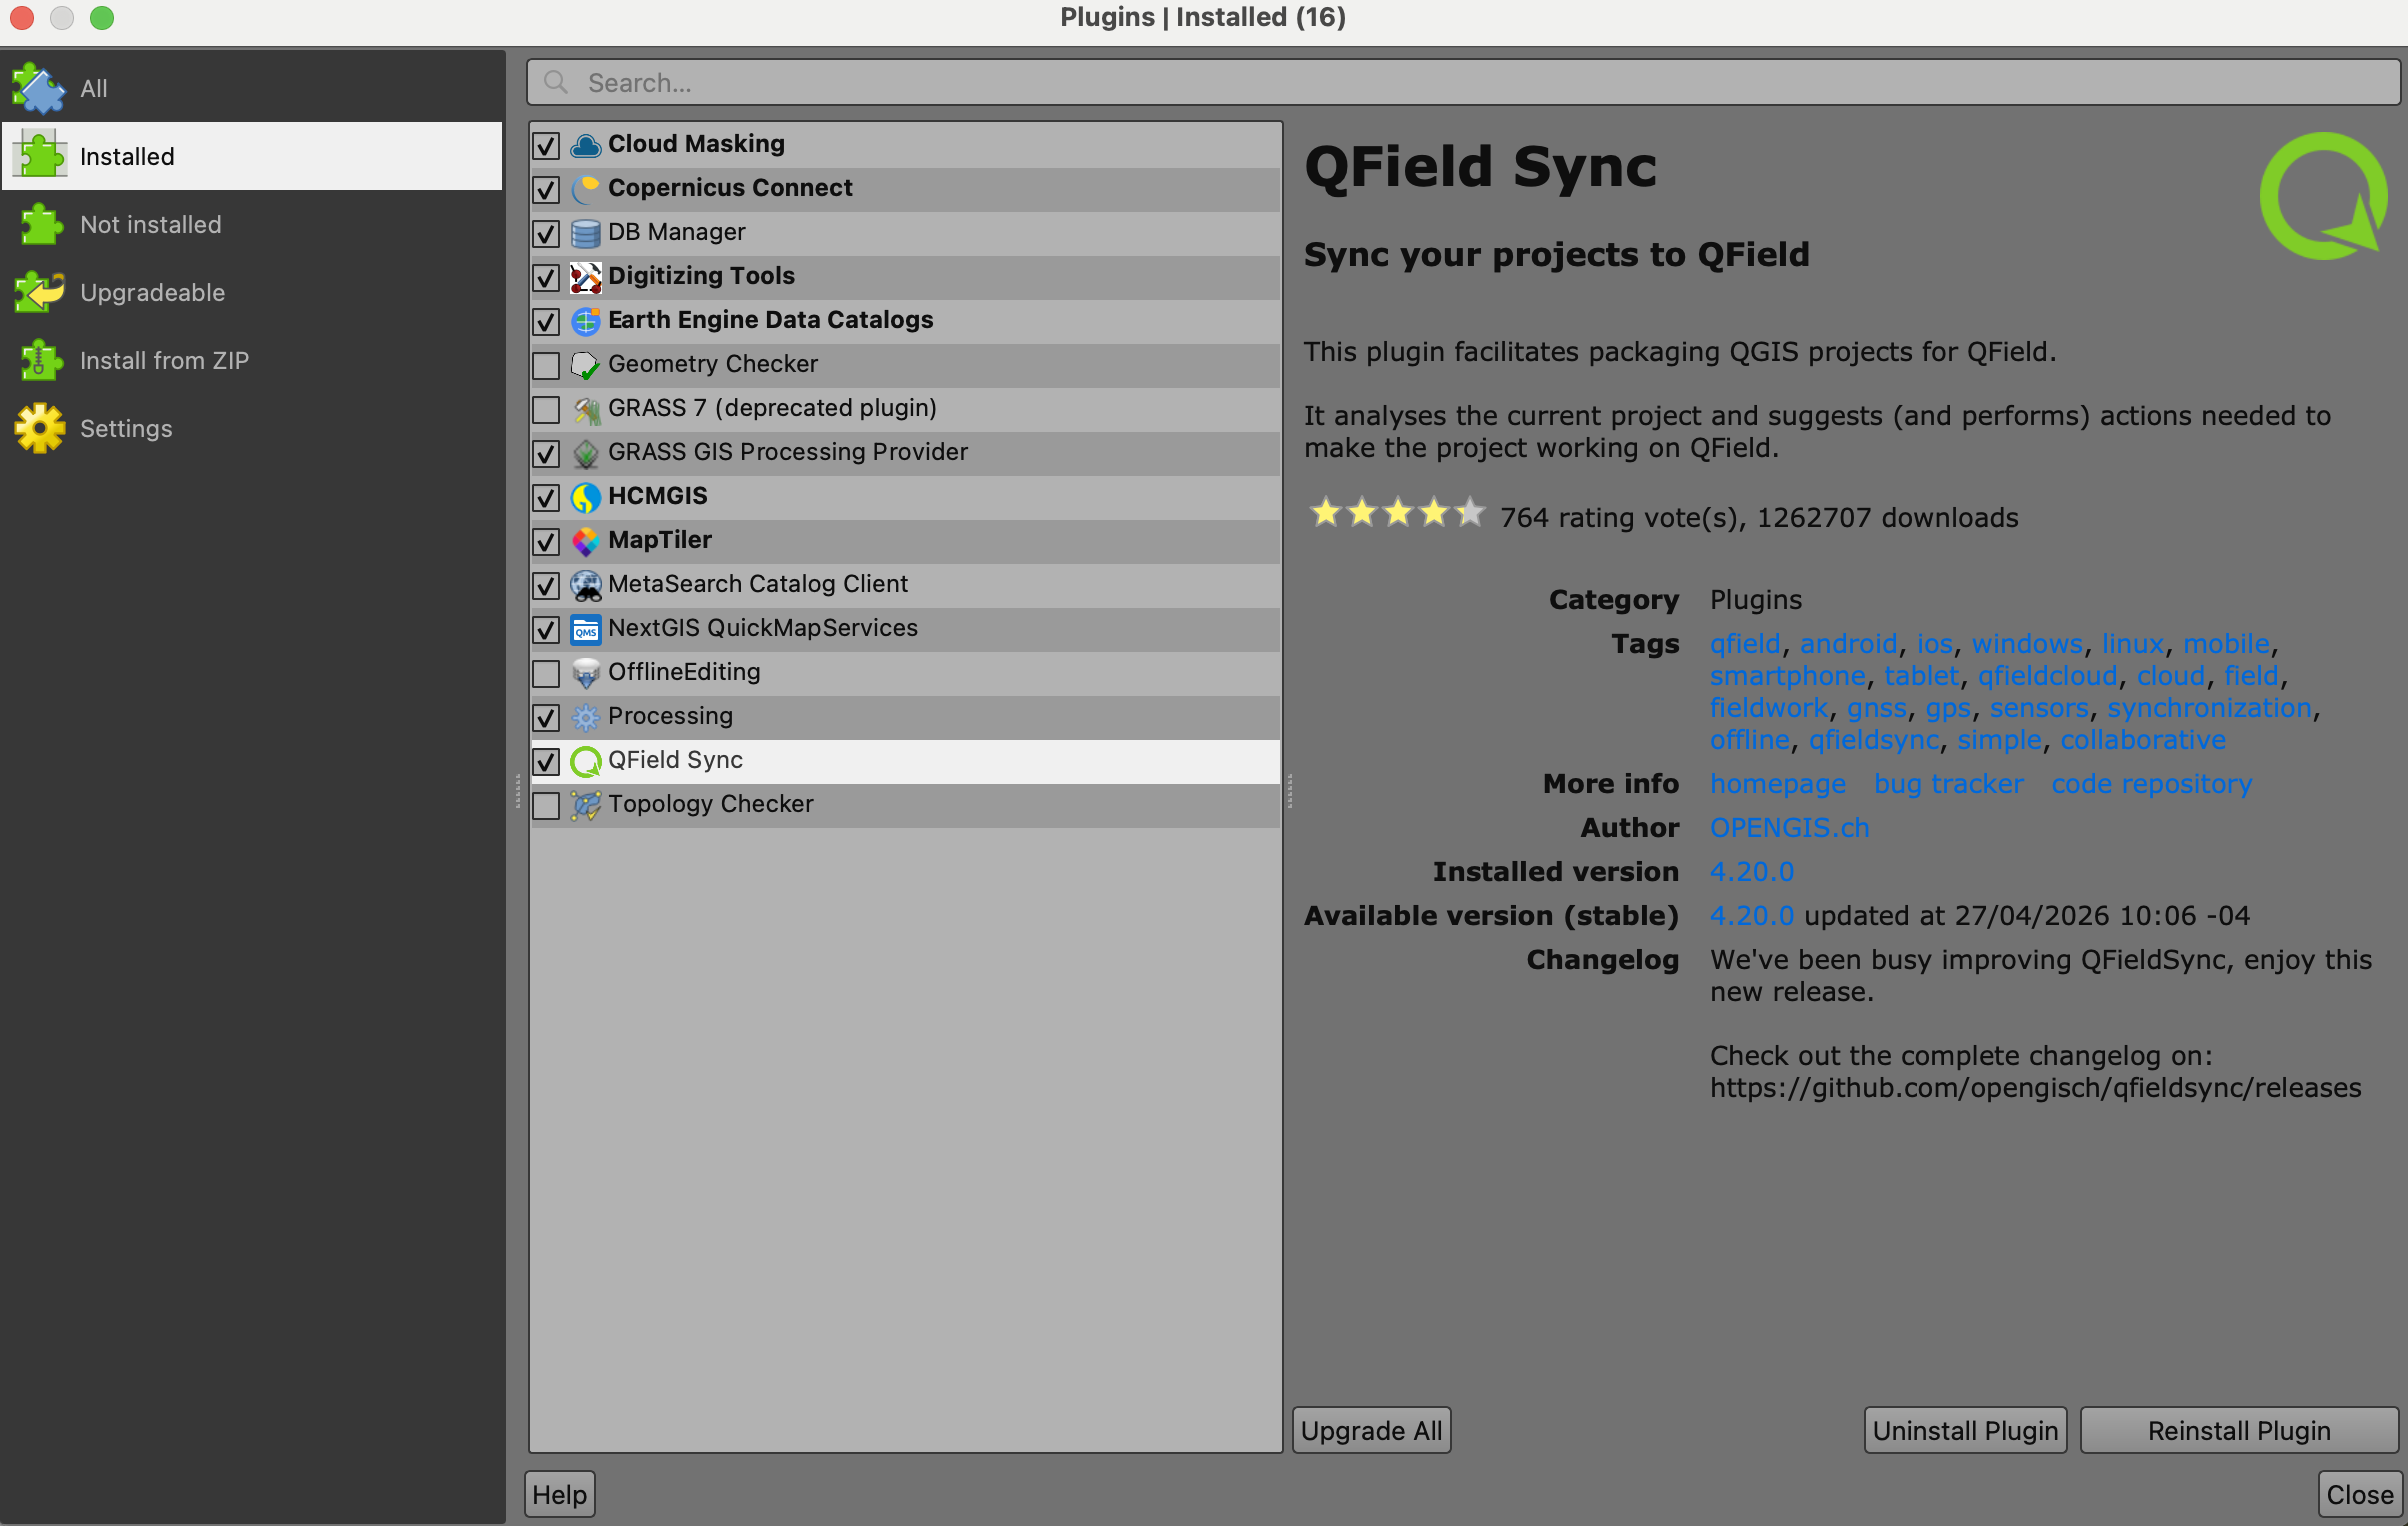
Once you have your project ready in QGIS, you just use the plugin to sync it with your QFieldCloud account.
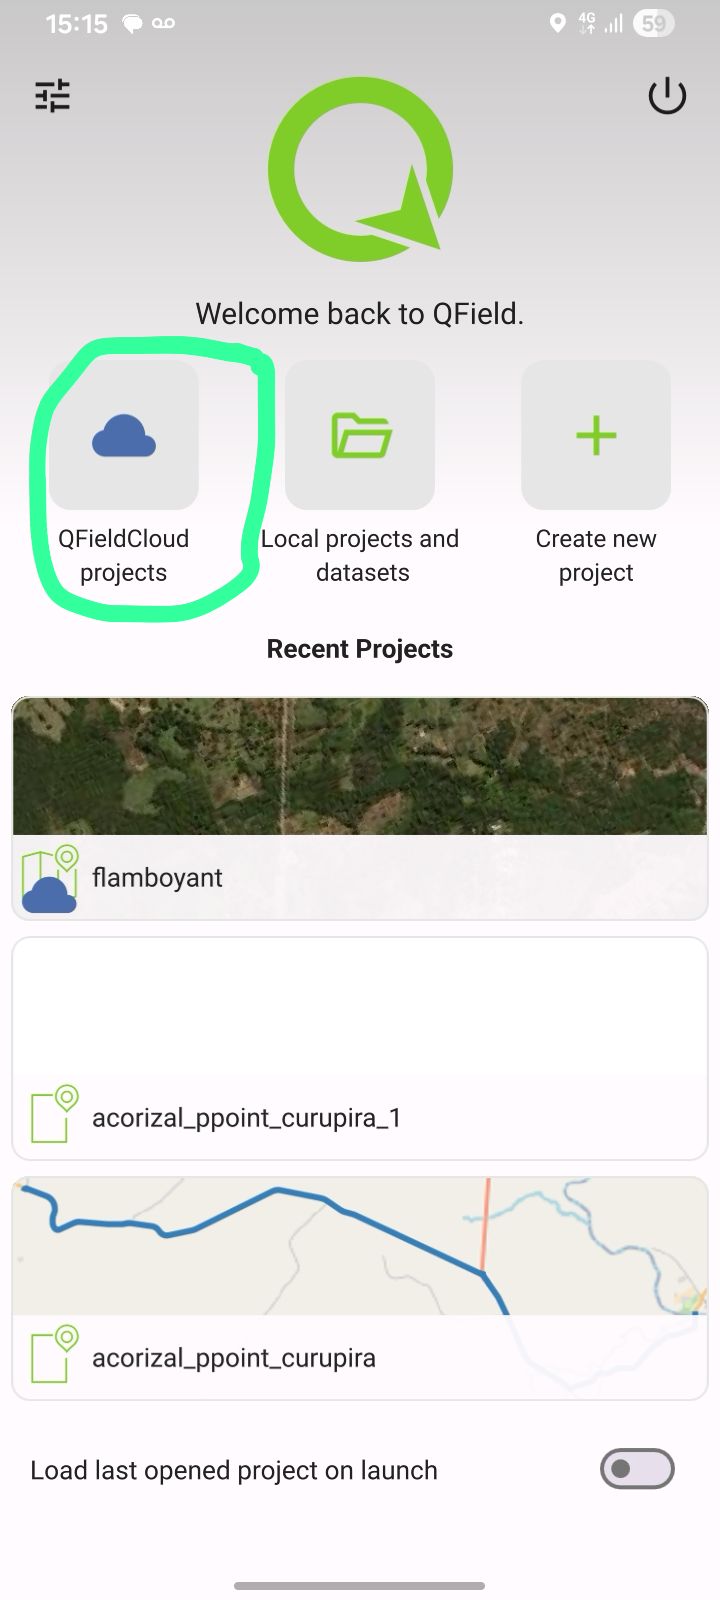
Then, you just log in to the app on your phone, sync it after clicking in “QFieldCloud projects, and your project will pop up in your list.
AVENZA
I also build the Avenza maps in QGIS and save them as a GeoPDF. (Check my other post on GeoPDFs for the how-to).
The most important thing here is that the map has enough detail for you to know exactly where you are. You don’t need super high resolution—that just makes the file heavy. This is a step I always include because it allows colleagues to help with data collection, even if they aren’t tech-savvy or familiar with the area. Avenza is simple enough for the whole team to use.
UPDATE (May 2026): The free version of Avenza no longer lets you upload your own custom maps to use as a base. However, you can still mark points using the app’s own built-in basemap.
- In the field —> Avenza, QField
Once you’re out there, start marking your points.
Pro tip: Be consistent!
If you’re recording the same thing, always type it the same way (e.g., “Main House” vs “main house” vs “farmhouse”). If you don’t, you’re just creating more work for yourself later during geoprocessing.
Sometimes, just a location is enough—like if you’re just marking crop areas where the info doesn’t change. I often do this when mapping residences just by name.
If you have a more complex plan, you might use QField to set up “attribute classes” beforehand. That way, instead of typing, you just pick an option from a dropdown menu. This is where QField really shines compared to Avenza.
But keep in mind: You might not always know what you’ll find in the field that you need to register.
If you’re working in a group, some people might find QField a bit intimidating. In my experience, Avenza has zero “learning curve” and resistance from the team.
- Back from the field —> QGIS
Export the data: If you took photos, your file will be a .kmz. Save that as a .kml on your computer, and it will automatically “extract” the photos into the folder. This is handy because you usually won’t need those photos embedded in the QGIS vector file itself.
Import the .kml into QGIS: You’ll have a vector file now, but you might want to save it as a .gpkg (GeoPackage) to keep it consistent with your project.
Data Processing: This is where you clean up the attribute table. The messier your field notes, the harder this part is. Use the Field Calculator to create clean, ready-to-use variables. Creating “True/False” (boolean) variables for specific targets also helps a lot.
Final Maps: These layers become the foundation for everything else—land use maps, slope analysis, housing locations, etc.
There are plenty of other apps for offline maps and points, but these are the ones I know and use!